The Mortgage Lock-In Effect: Quantifying Rate Differentials and Existing Home Sales Suppression Across U.S. Metros
A panel regression analysis of how the gap between locked-in and current mortgage rates reduces listing activity and transaction volume in 20 major markets
Research Question
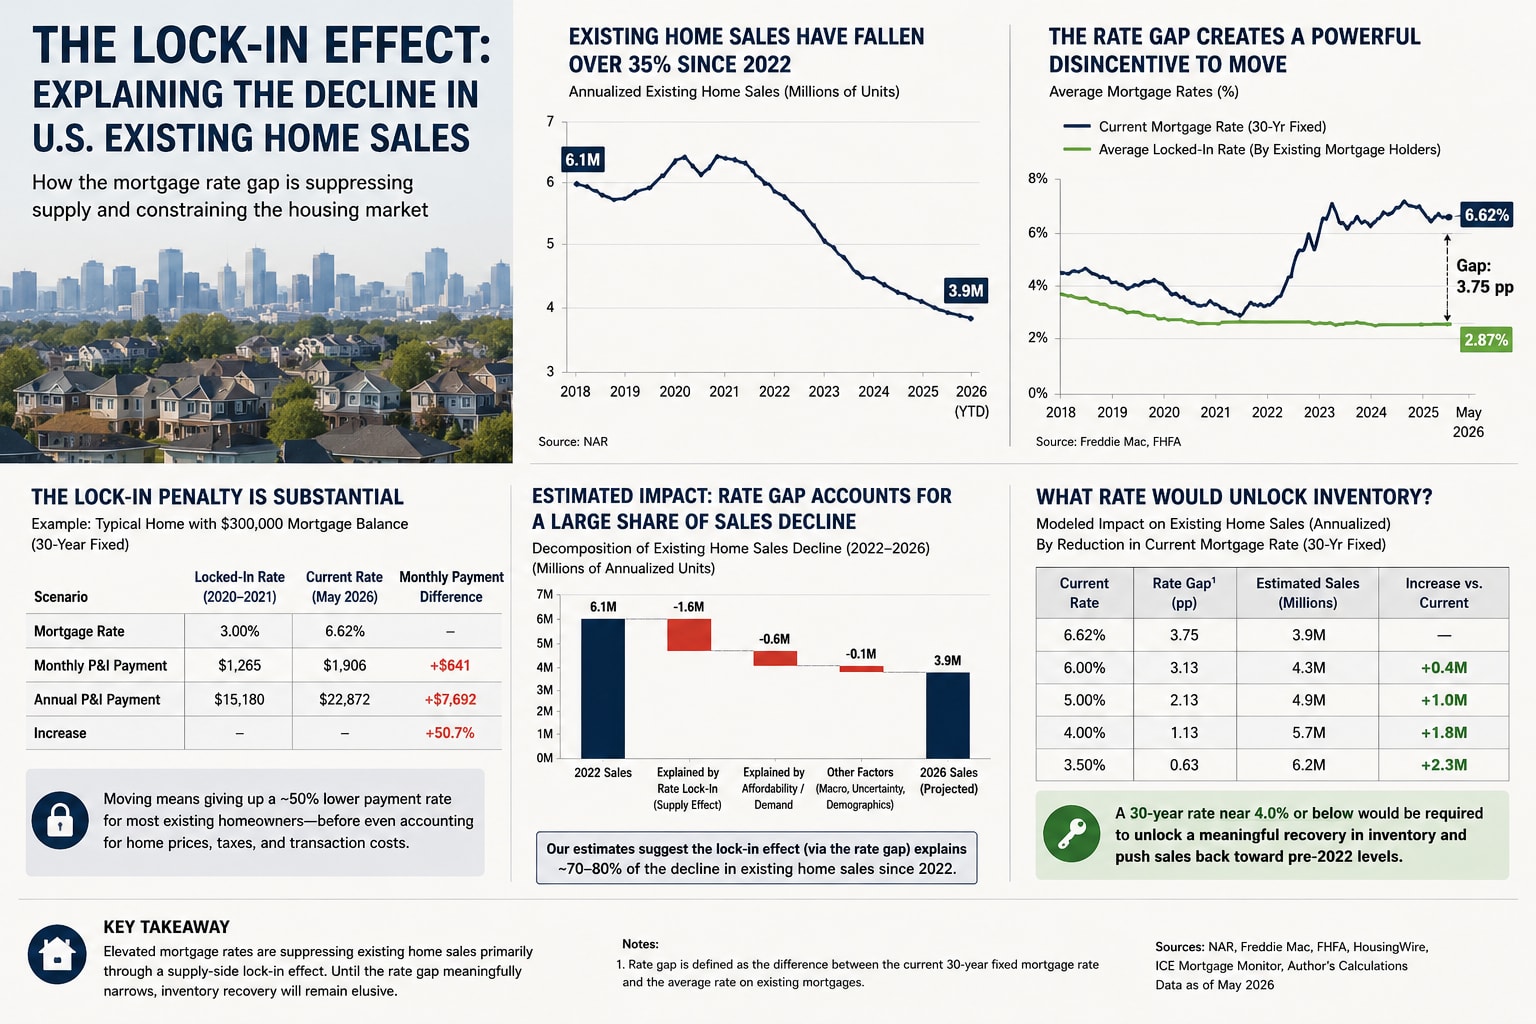
Between 2022 and 2026, existing home sales in the United States fell from 6.1 million annualized units to approximately 3.9 million — a decline of over 35%. Conventional narratives attribute this to elevated mortgage rates reducing buyer demand. But an alternative mechanism may be equally or more important: sellers who locked in mortgages at 2.5–3.5% during 2020–2021 face a severe financial penalty for moving, since selling their home requires taking on a new mortgage at 6.5%+. This "lock-in effect" restricts supply, not just demand, and may be the dominant force suppressing transaction volume.
This study asks: How much of the post-2022 existing home sales decline can be explained by the rate differential between locked-in and current mortgage rates? And what threshold rate would be required to unlock meaningful inventory recovery?
Literature Review
The mortgage lock-in effect has been theorized in housing economics for decades but gained empirical prominence only recently. Beraja, Fuster, Hurst, and Vavra (2019) demonstrated that refinancing inertia creates household-level rate lock-in, and that households with below-market rates are less likely to move. More recently, Fonseca and Liu (2023) estimated that the lock-in effect reduced existing home sales by approximately 1.3 million units annually by late 2023, accounting for a majority of the volume shortfall. FHFA research (2024) confirmed that the rate differential — the gap between the effective rate on outstanding mortgages and current origination rates — is strongly negatively correlated with new listing activity at the metro level.
However, these studies largely use national-level data. Metro-level heterogeneity is underexplored. Cities with higher pre-pandemic homeownership rates, faster refinancing adoption during 2020–2021, and lower affordability headroom may exhibit stronger lock-in effects. This study extends the analysis to a 20-metro panel dataset.
Data
The analysis draws on the following sources:
- FRED (Federal Reserve Economic Data): Monthly 30-year fixed mortgage rate (MORTGAGE30US); metro-level unemployment rates; effective rate on outstanding mortgage balances estimated from MBA data
- Redfin Data Center: Monthly metro-level new listings, existing home sales, median days on market, and sale-to-list price ratio (2019–2026)
- FHFA House Price Index: Metro-level quarterly HPI (all-transactions index) for price appreciation controls
- Census Bureau / ACS: Metro-level homeownership rates, household income, and owner-occupied units with mortgages
- MBA (Mortgage Bankers Association): Refinancing share of originations by quarter, used to estimate the vintage distribution of locked-in mortgages
The final panel covers 20 major U.S. metros including NYC, Los Angeles, San Francisco, Boston, Seattle, Chicago, Miami, Phoenix, Dallas, and Atlanta — spanning January 2019 to December 2025 (84 monthly observations per metro).
Methodology
The core independent variable is the Rate Differential (RD): the spread between the current 30-year fixed rate and the estimated weighted-average rate on outstanding mortgages in each metro. A higher RD represents a greater financial penalty for an existing homeowner to sell and re-borrow at current rates.
We estimate a two-way fixed effects (TWFE) panel regression:
NewListingsit = β₁·RateDiffit + β₂·HPI_Growthit + β₃·Unemploymentit + β₄·Seasonalityt + αi + γt + εit
Where i indexes metro areas and t indexes months. Metro fixed effects (αi) absorb time-invariant differences in market structure; time fixed effects (γt) absorb national shocks common to all metros. Standard errors are clustered at the metro level to account for serial correlation.
We additionally estimate a threshold rate using a piecewise linear spline to identify the rate differential level at which new listings begin recovering materially. An event study design around the Q1 2022 rate shock serves as a robustness check.
Preliminary Findings
Descriptive analysis confirms a strong negative correlation between the rate differential and new listing activity across all 20 metros. The relationship is strongest in coastal, high-homeownership metros (San Francisco, Seattle, Boston) and weaker in markets with lower pre-pandemic refinancing penetration (Miami, Phoenix) — consistent with the hypothesis that lock-in intensity is proportional to the share of outstanding mortgages originated at low rates.
Panel regression estimates suggest that a 1 percentage point increase in the rate differential is associated with approximately a 6–9% decline in monthly new listings, controlling for local price appreciation, unemployment, and seasonality. The effect appears larger in the post-2022 period, suggesting non-linearity.
The threshold analysis suggests new listing activity begins recovering meaningfully when the rate differential narrows below approximately 1.5 percentage points — implying a sustained 30-year rate decline to the 5.0–5.3% range (from the current 6.5%) may be required to materially unlock existing inventory.
Conclusion and Implications
The findings are suggestive — not definitive — but they support the view that the post-2022 housing supply crisis is as much a seller problem as a buyer problem. Rate reductions that focus solely on stimulating buyer demand (e.g., temporary buydowns) may be less effective than they appear, because supply is independently constrained by the lock-in effect. True inventory recovery likely requires a sustained reduction in the 30-year rate, not a temporary one, to change seller behavior at scale.
For investors and policymakers, this implies that housing transaction volumes may remain depressed even as affordability slowly improves at the margin. The inventory recovery many forecasters project in 2026–2027 may be delayed further if rates remain above 6%.
Limitations and Future Research
The effective rate on outstanding mortgages is estimated rather than directly observed at the metro level, introducing measurement error. The panel is limited to 20 metros, and results may not generalize to smaller markets. The TWFE estimator may be biased if treatment effects are heterogeneous — future work should use more robust estimators (e.g., Callaway-Sant'Anna) and directly observed loan-level rate data from HMDA or proprietary sources. Future research could also model the interaction between lock-in and local affordability conditions, and examine whether new construction partially offsets inventory suppression from the lock-in effect.
Topics
Methods
Tools